

1. 下载
https://prometheus.io/download/
wget https://github.com/prometheus/MysqLd_exporter/releases/download/v0.14.0/MysqLd_exporter-0.14.0.linux-amd64.tar.gz
2.安装 MysqLd_exporter
tar -xvf MysqLd_exporter-0.14.0.linux-amd64.tar.gz -C /usr/local
cd /usr/local
mv MysqLd_exporter-0.14.0.linux-amd64 MysqLd_exporter
3. 创建MysqL 监控账号
CREATE USER 'prometheus'@'%' IDENTIFIED BY 'root' WITH MAX_USER_CONNECTIONS 10;
GRANT PROCESS, REPLICATION CLIENT, REPLICATION SLAVE, SELECT ON *.* TO 'prometheus';
4.创建 MysqLd_exporter 用的MysqL登录文件
vi /usr/local/MysqLd_exporter/my.cnf
[client]
host=127.0.0.1
port=3306
user=prometheus
password=root
5.启动 MysqLd_exporter 进程
./MysqLd_exporter --help

nohup ./MysqLd_exporter \
--collect.info_schema.processlist.processes_by_user \
--collect.info_schema.processlist.processes_by_host \
--collect.MysqL.user.privileges \
--collect.info_schema.processlist \
--collect.MysqL.user \
--collect.info_schema.tables \
--collect.info_schema.innodb_tablespaces \
--collect.info_schema.innodb_metrics \
--collect.global_status \
--collect.global_variables \
--collect.slave_status \
--collect.perf_schema.indexiowaits \
--collect.perf_schema.tablelocks \
--collect.perf_schema.eventsstatements \
--collect.perf_schema.eventsstatementssum \
--collect.perf_schema.eventswaits \
--collect.auto_increment.columns \
--collect.binlog_size \
--collect.perf_schema.tableiowaits \
--collect.perf_schema.replication_group_members \
--collect.perf_schema.replication_group_member_stats \
--collect.perf_schema.replication_applier_status_by_worker \
--collect.info_schema.userstats \
--collect.info_schema.clientstats \
--collect.perf_schema.file_events \
--collect.perf_schema.file_instances \
--collect.perf_schema.memory_events \
--collect.info_schema.innodb_cmpmem \
--collect.info_schema.query_response_time \
--collect.engine_innodb_status \
--collect.info_schema.tablestats \
--collect.info_schema.schemastats \
--collect.info_schema.innodb_cmp \
--collect.slave_hosts \
--collect.info_schema.replica_host \
--config.my-cnf=/usr/local/MysqLd_exporter/my.cnf &
#注意 \ 前后不能多空格
6.检查是否有监控数据
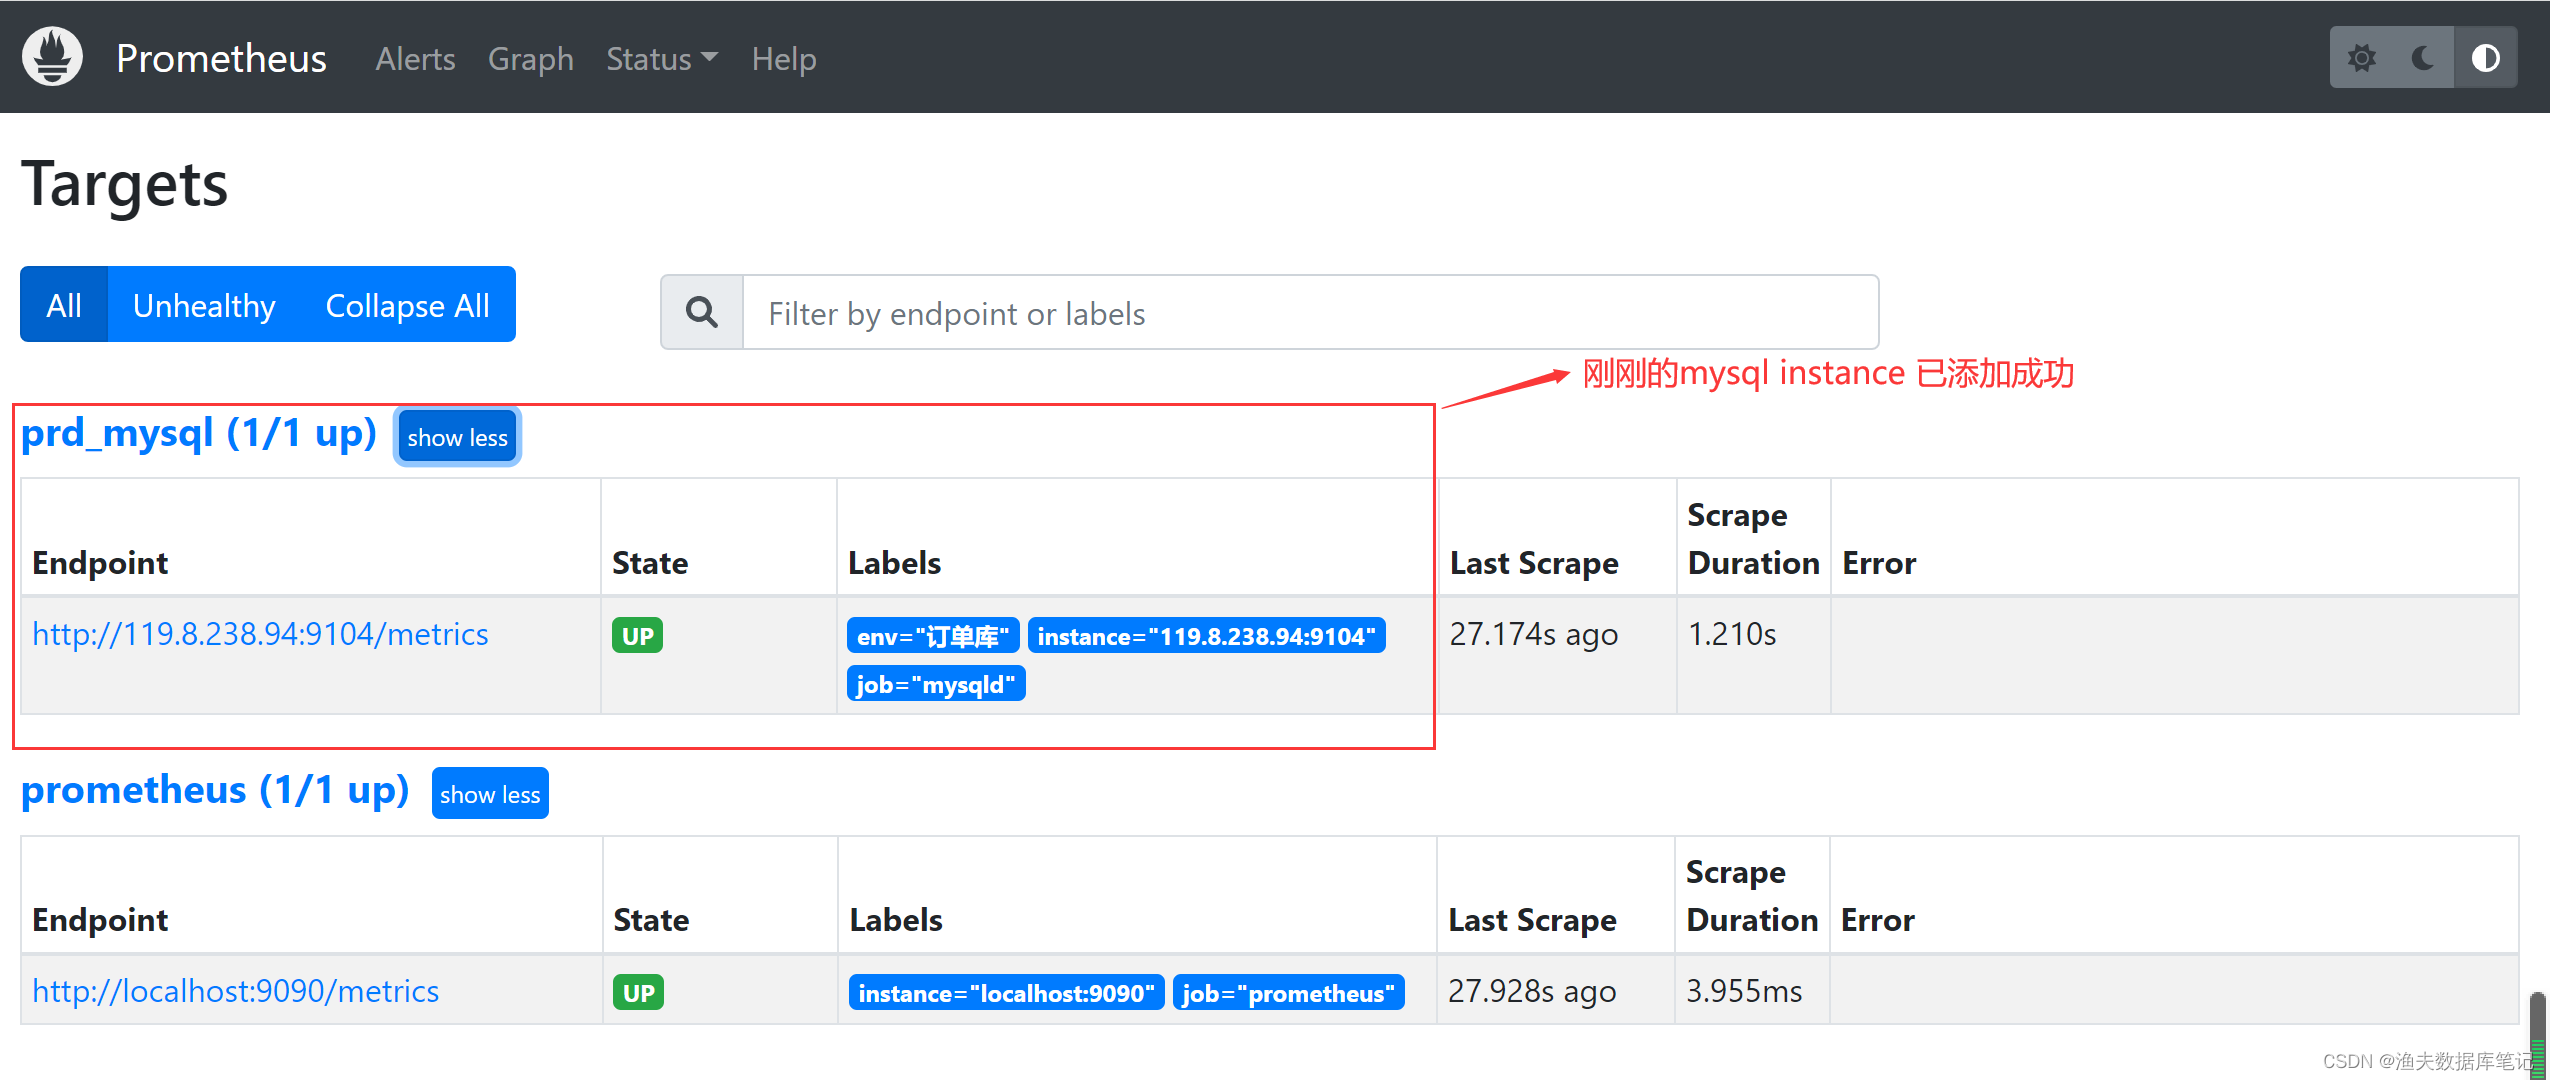
http://119.8.238.94:9104/metrics创建 prd_MysqL.json vi /usr/local/prometheus/sd_config/prd_MysqL.json ,添加如下内容
[
{
"targets": [ "119.8.238.94:9104" ],
"labels": {
"env": "订单库",
"job": "MysqLd"
}
}
]修改 prometheus 配置文件 prometheus.yml scrape_configs: 部分添加如下内容
- job_name: "prd_MysqL"
file_sd_configs:
- files: ['/usr/local/prometheus/sd_config/prd_MysqL.json']
refresh_interval: 120s
3)检查 prometheus 配置文件是否能正常读取
./promtool check config prometheus.yml
Checking prometheus.yml
 SUCCESS: prometheus.yml is valid prometheus config file Syntax
4)动态调整 prometheus 配置
##启动时加上 --web.enable-lifecycle 参数,后期可以通过如下方式动态调整prometheus配置,动态调整方式如下:
curl -v --request POST 'http://localhost:9090/-/reload'
curl -X POST http://localhost:9090/-/reload
#如果启动时没有使用--web.enable-lifecycle,可以使用  kill -HUP pid 方案热加载
8.查看 prometheus 中是否成功添加了该 instance
1)在 grafana 中添加相应prometheus 数据源(如果该数据源也添加过忽略该步)
(7条消息) 通过 Grafana 对prometheus 监控做可视化_渔夫数据库笔记的博客-CSDN博客
2)给该数据源添加 dashboard(如果已添加则忽略该步)
采集配置好,正常采集有了数据之后,还需要为 Grafana 添加监控面板进行展示,如果只是看 MysqL 或 MariaDB 的一些概览情况,可以导入grafana.com
的这个面板:https://grafana.com/grafana/dashboards/7362
如果需要更丰富的面板,可以导入 percona 开源的一些面板,地址: https://github.com/percona/grafana-dashboards/tree/master/dashboards (导入 MysqL_
开头的 json 文件中的内容即可)。

原文地址:https://www.jb51.cc/wenti/3287028.html
版权声明:本文内容由互联网用户自发贡献,该文观点与技术仅代表作者本人。本站仅提供信息存储空间服务,不拥有所有权,不承担相关法律责任。如发现本站有涉嫌侵权/违法违规的内容, 请发送邮件至 dio@foxmail.com 举报,一经查实,本站将立刻删除。

